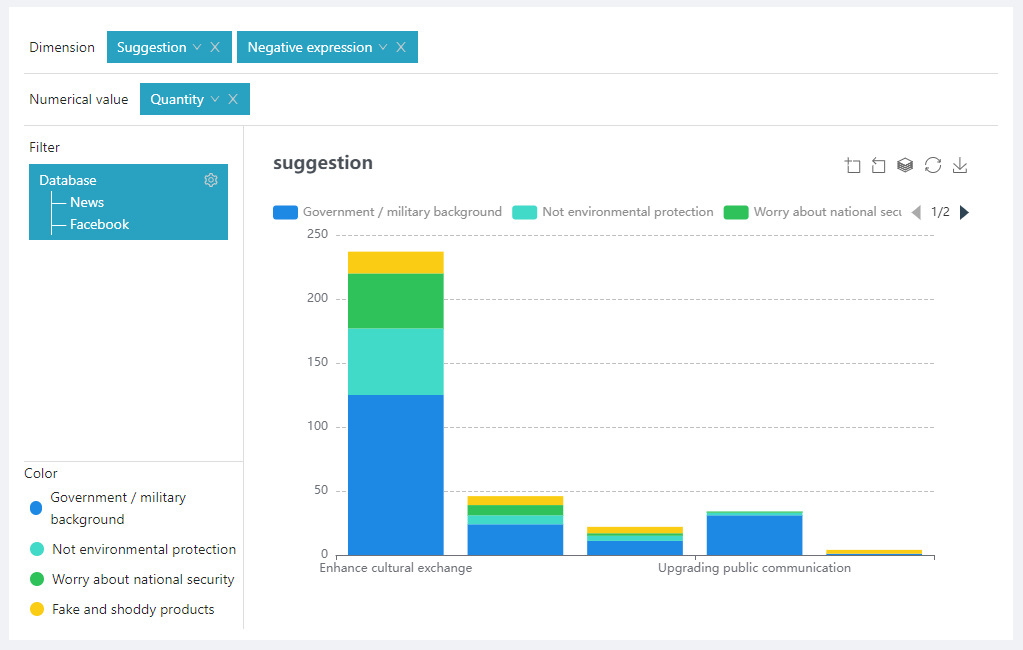
The Stacked graph is an extension of the vertical bar chart. The difference is that the data values of the column chart are arranged in parallel, while the stacked column chart is stacked one by one. It can display the total amount of each category, as well as the size and proportion of each small category included in the category, so it is very suitable for dealing with the relationship between part and the whole..
DiVoMiner® User Manual
- Preface
- Quick start
- Online content analysis
- Overview
- Data management
- Data exploration
- Codebook
- Reliability test
- Coding
- Coding performance
- Quality monitoring
- Coding result
- Statistical analysis
- Sharing a folder
- Chart library
- Chart editing interface
- Statistics module
- Descriptive statistics
- Relevance measurement
- Chi-square
- Unary regression analysis
- Granger causality
- Chart type
- Table
- Two-dimensional table
- Histogram
- Stacked graph
- Percentage stacked chart
- Bar graph
- Bar stacked chart
- Bar percentage stacked chart
- Line chart
- Area chart
- Area stacked map
- Percentage area stacked chart
- Biaxial Chart
- Pie chart
- Word cloud map
- Radar chart
- Scatter chart
- Heat map
- Sankey diagram
- Chart general setting
- Advanced statistics
- Normality test
- Create a new normality test task
- t-Test
- Create a new t-Test task
- One-way analysis of variance
- Create a new One-way analysis of variance task
- Multi-factor analysis of variance
- Create a new multi-factor analysis of variance
- Linear regression
- Create a new linear regression analysis task
- Binary logistic regression
- Create a new binary logarithmic regression analysis task
- K-Means clustering (numeric)
- Create a new K-Means clustering (numeric) task
- Reliability analysis
- Create a new reliability analysis task
- Validity analysis
- Create a new validity analysis task
- Multiple-choice analysis
- Create a new multiple-choice analysis task
- Algorithm mining
- Sentiment analysis (positive and negative)
- Create a sentiment analysis (positive and negative) task
- Sentiment analysis (emotion classification)
- Create a sentiment analysis (emotion classification) task
- K-Means
- Create a K-Means task
- Topic model (LDA)
- Create a topic model (LDA) task
- Similarity analysis
- Create a similarity analysis task
- Semantic network analysis
- Create a semantic network analysis task
- Social network analysis
- Create a social network analysis task
- Algorithm & model computing resources fees
- Language Recognition
- Purchase algorithm quota
- Creating a new language identification task
- Word frequency and part-of-speech analysis
- Tools
- Project setting
- Management
- Home
- Docs
- DiVoMiner® User Manual
- Statistical analysis
- Stacked graph