
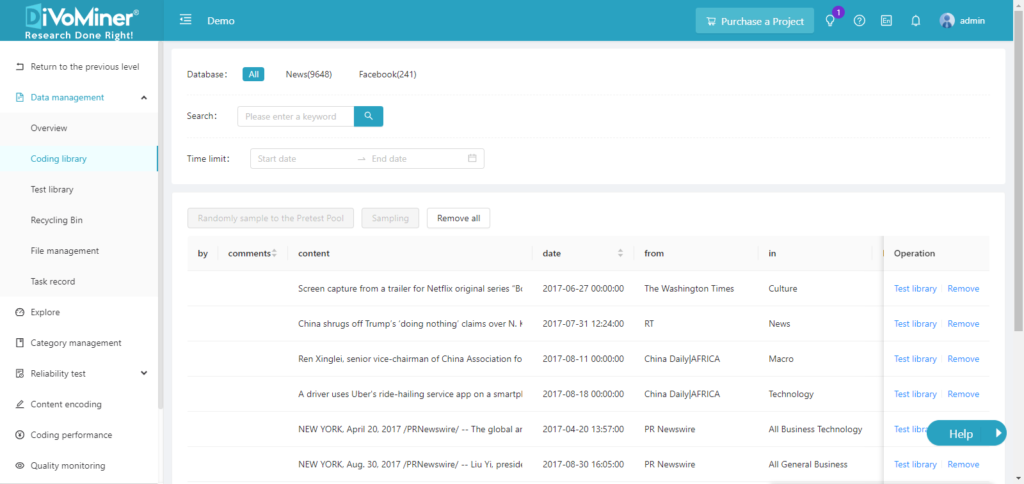
The coding library is the core of the analysis on the DiVoMiner® platform. All content analysis procedures, statistical analysis and visualization, are based on the data in the coding library. The coding library can display data from all databases or a certain sub-database, such as a News database, or a Facebook database. Different sub-databases can have different data format setting.
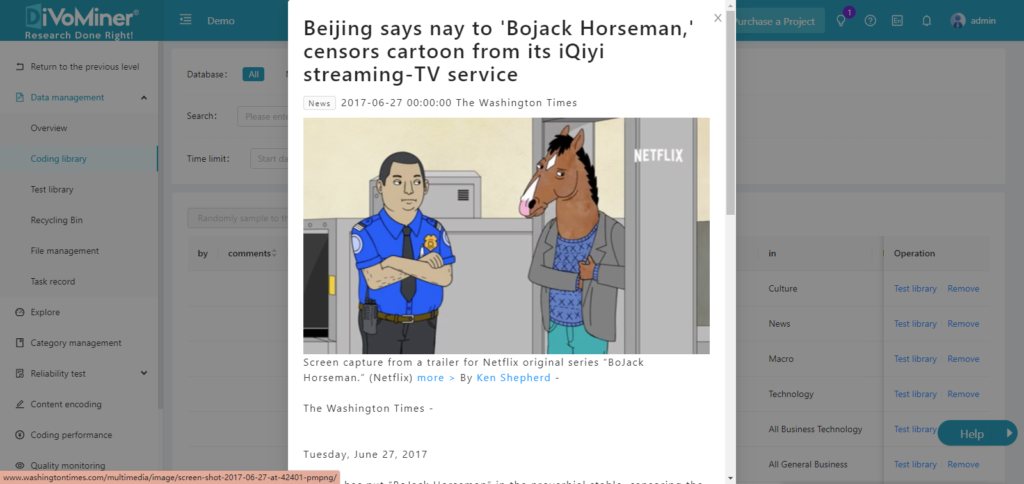
You can set up the database and upload data in the [Data management] on the [Overview] page. To check the created database, go to the [Coding library] page and click on a piece of data to view the specific content.
TIPS: If you want to change the data display, such as the variables in different fields, adjust them in the corresponding database on the [Overview] page. On the lower right corner of the database, click [More operations ]-[Display setting].
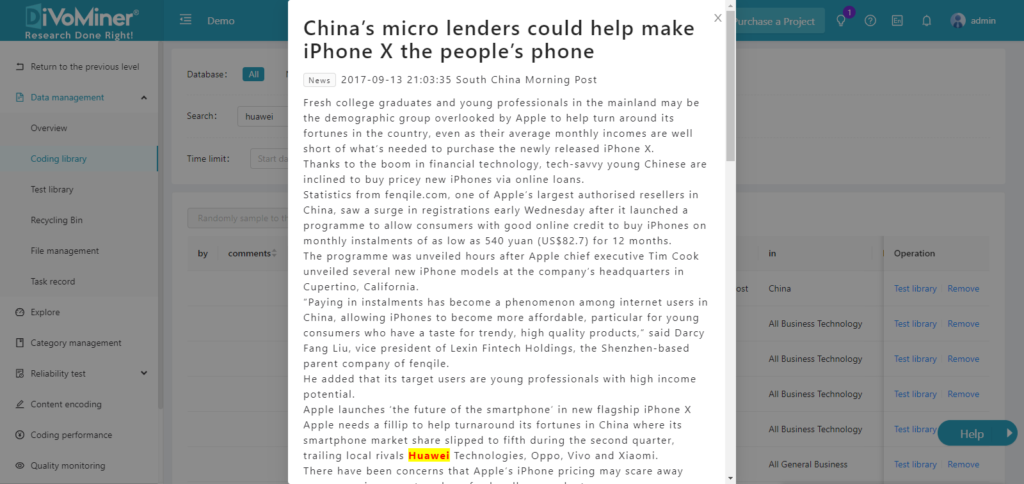
Search: In the Coding library, you can search for data using keywords or a certain time range. For example, in the search bar, input keyword “Mobike” and click [Confirm]. The corresponding keywords are highlighted in yellow, and you can click on the data to see the details of the text.
TIPS: [Coding library] displays up to 1000 pages with a total of 10,000 data samples. If you want to view more data, please use the search function, such as setting the date to narrow down the data range displayed.
Leave A Comment?