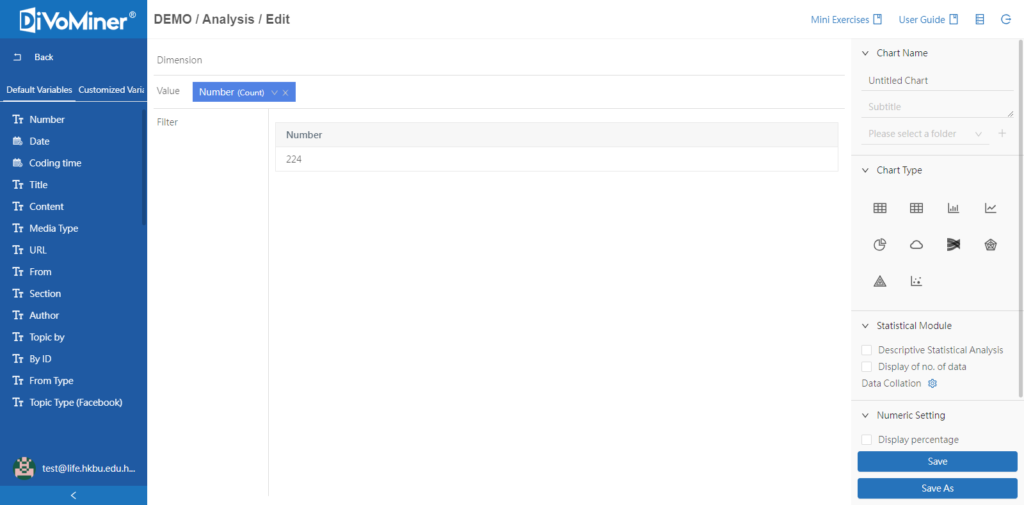
Analysis is a module that performs statistical analysis of the variables in your research, such as descriptive statistics, relevance analysis and regression analysis. And understand the trends, outliers, and patterns of your data with DiVoMiner® visualization tools. This section is divided into three functional areas: “Variable list”, “Chart editing”, and “Setting” ( from left to right).

Variable list
Variable list is a list of data variables, which is further divided into “Customized variable”, “System variable”and “Algorithm variable”. These three sets of variables can be combined randomly for charts design and multivariate analysis.
Chart Editing
The Chart Editing area mainly includes three subareas where variables can be dragged and dropped: “Dimension”, “Value”, and “Filter”.
Setting
There are settings for “Chart Name”, “Statistics Module”, “Chart Type” and “Chart Style” in this area.
