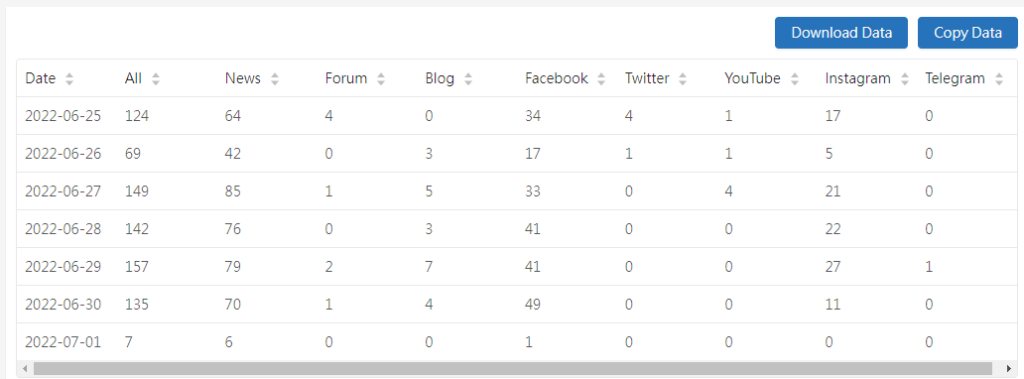
The trend chart shows trends in the searched information by day as the time unit which is continuously classified and aggregated based on the set topic keywords and media types. The page is divided into two modules from top to bottom: buzz trend chart and data download data.
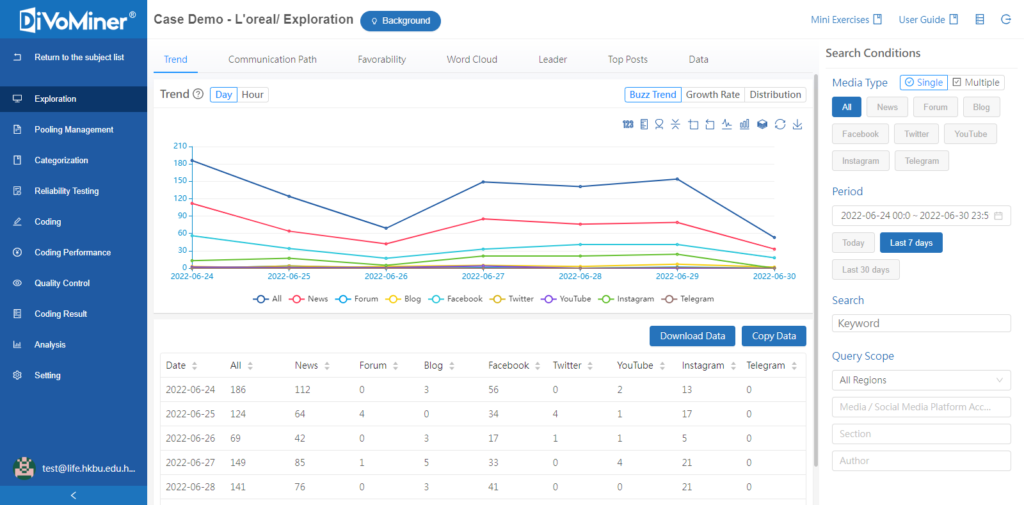
Trend Chart
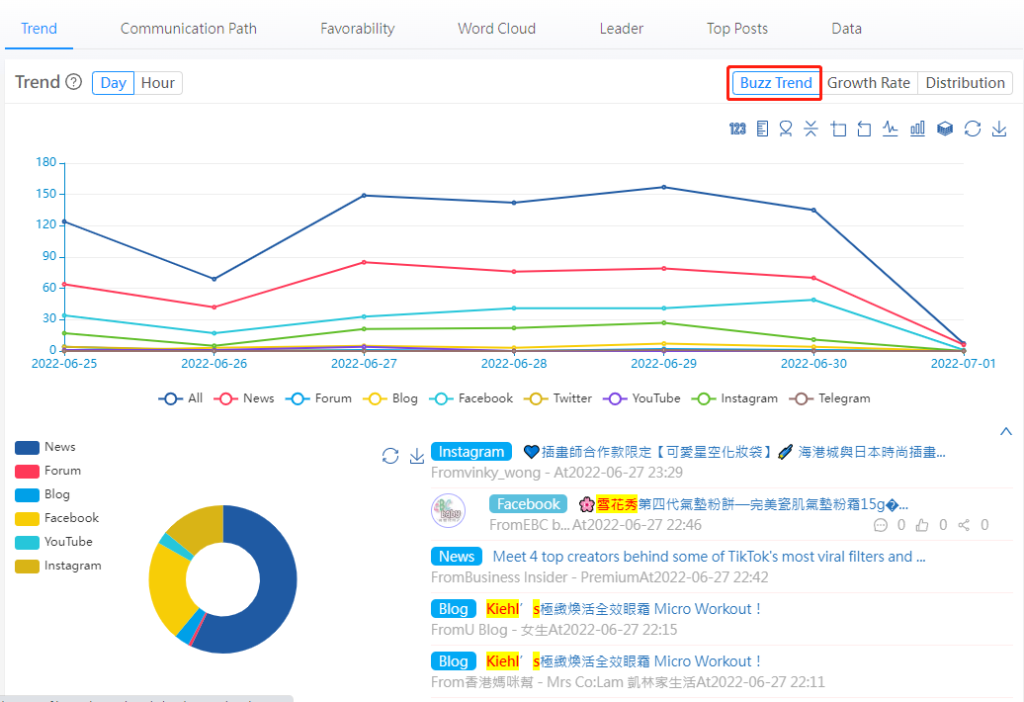
The trend chart shows buzz trends by day in a specific period. Trend charts can be selected as line charts and histograms and the histogram can also be stacked and tiled. Trend charts can be downloaded in PNG format. Click any data points on the chart to display data of the selected date.
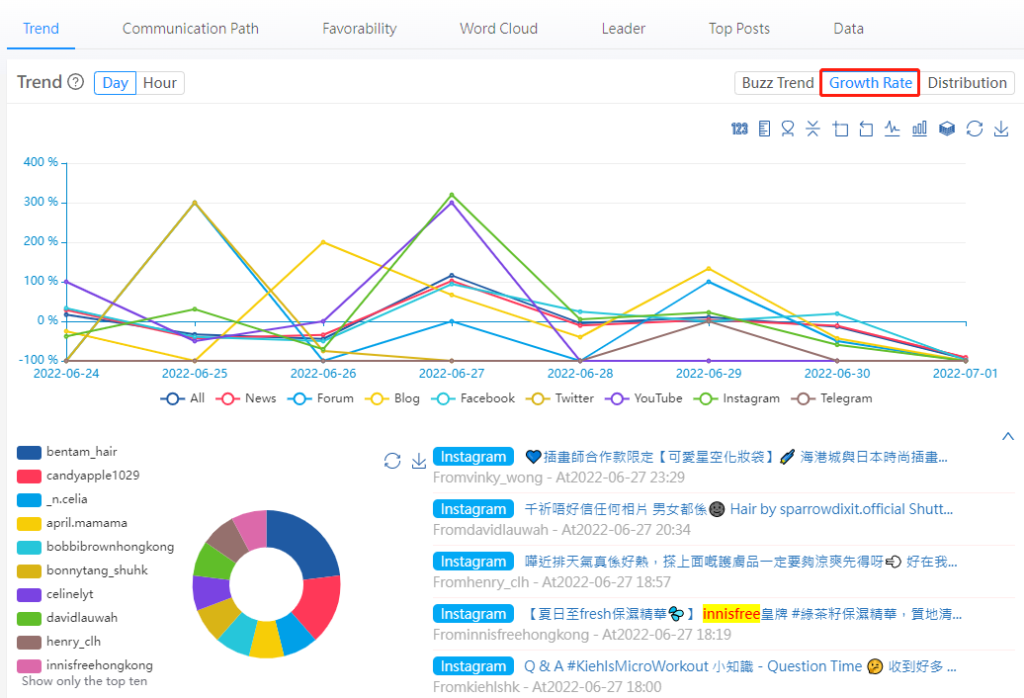
Growth Rate Chart
The growth rate chart represents the growth rate of buzz trend by day within the selected time range. The trend chart compares the data of the current day with the data of the previous day. A positive growth rate indicates positive buzz growth and vice versa. The growth rate chart can be selected as a line graph and a histogram, and the histogram can also be stacked and tiled. Trend charts can be downloaded in PNG format. Click any data points on the chart to display data of the selected date.
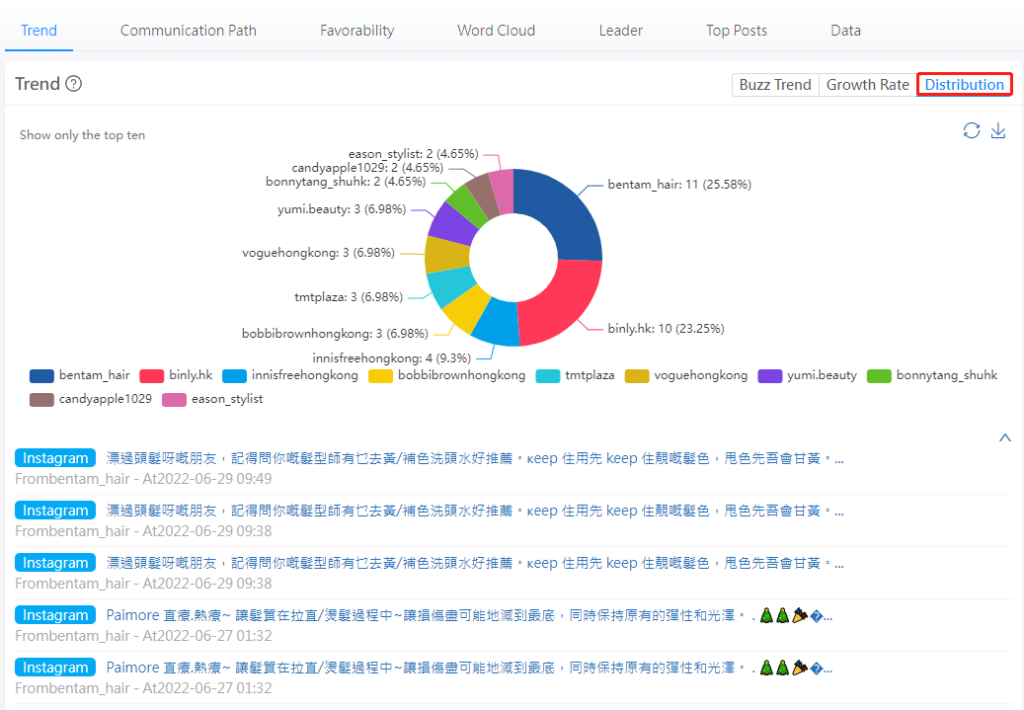
Distribution Chart
With the media type as the statistical standard, you can generate a pie chart in the selected time range. In the distribution chart, all the data of the specific media will be displayed below by clicking any media type.
Download Data
You can download the detailed data of the trend charts and the distribution charts in CSV format.
