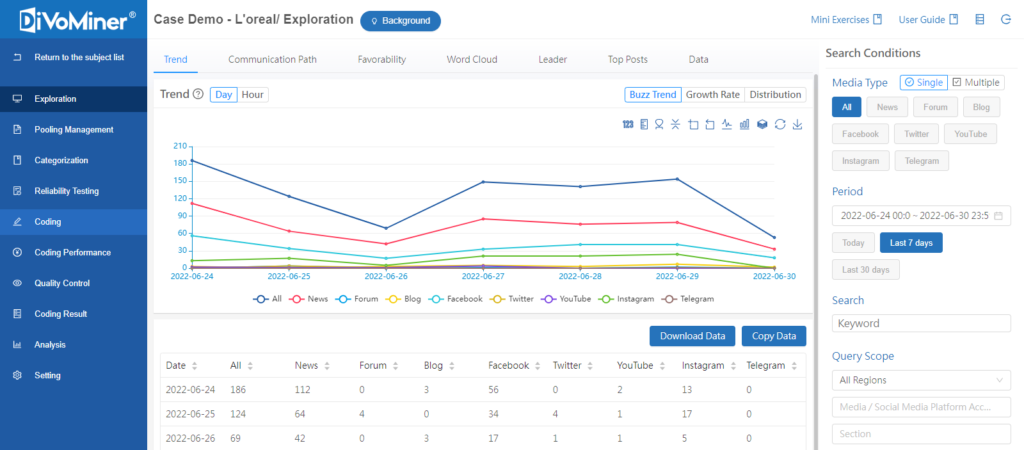
Monitoring is a page where you can view the collected data after general settings and media settings. All content data is calculated online, and charts are generated in real-time. Both of them can be downloaded instantly. “Exploration” provides quick access to the content data of the topic and its statistics which is divided into seven parts: [Buzz], [Communication Path], [Favorability], [Word Cloud], [Leader], [Top Posts] and [Data].

