hkbucomm – Manual
  • Language
    • 繁體中文
    • English

DiVoMiner® User Manual

  • Preface
    • What is DiVoMiner®
  • Quick start
    • How to quickly understand the platform
  • Online content analysis
    • What is online content analysis
  • Exploration
    • Trend
    • Communication Path
    • Favorability
    • Word Cloud
    • Leader
    • Top Posts
    • Data
    • Search Conditions
  • Pooling Management
    • Overview
    • Source
    • Coding Pool
    • Pretest Pool
    • Recycle Bin
  • Categorization
    • Create a question
    • Categorization
    • Import
    • Export
    • Preview
    • Keyword setting
    • Sentiment Model Analysis
  • Reliability Test
    • Precoding
    • Reliability Calculation
    • Tracking
  • Coding
    • Review
    • Feedback
  • Coding Performance
    • Coding Performance
  • Quality Control
    • Download
    • Filter
    • Batch Coding
    • Batch Operation
    • Column Control
  • Coding Result
  • Subject Setting
  • Analysis
    • Chart Profiles
    • Chart editing interface
    • Statistics Module
    • Descriptive Statistical Analysis
    • Correlation Analysis
    • Chi-square
    • Regression Analysis
    • Granger causality
    • Chart type
    • Table
    • Cross Table
    • Bar Chart
    • Line Chart
    • Pie Chart
    • Word cloud map
    • Sankey
    • Radar
    • Heat map
    • Dot Chart
  1. Home
  2. Docs
  3. DiVoMiner® User Manual
  4. Analysis
  5. Pie Chart

Pie Chart

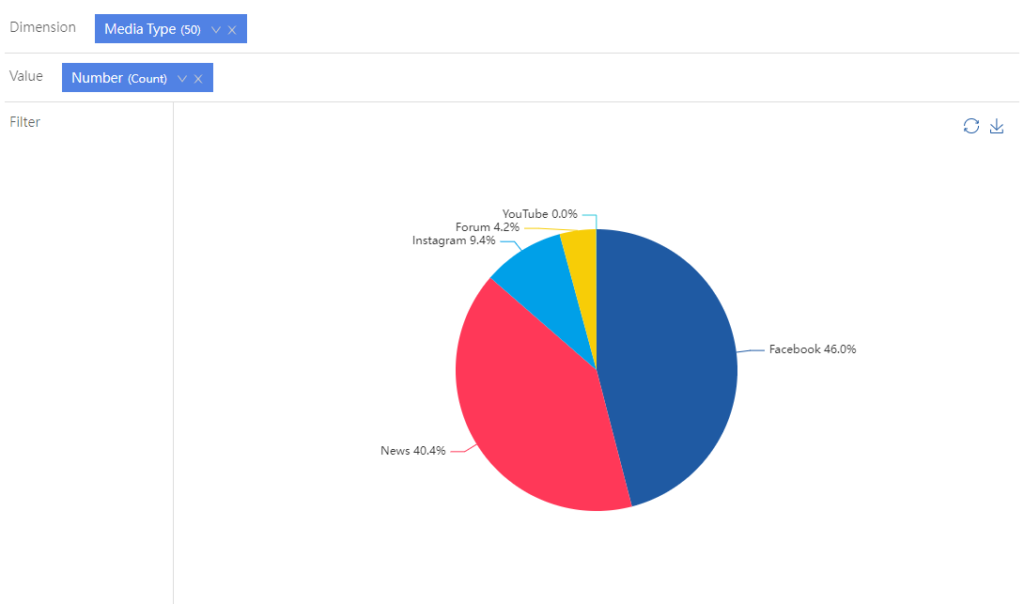
A pie chart must have one dimension and one value. In the following graph, put “Media Type” in the “Dimension” field, and “Number” in the “Value” field, to present the number of suggestion.

Still having problems? We are here to help.
Updated on July 4, 2022

Doc navigation

← Line ChartWord cloud map →
Was this article helpful? Yes No

How can we help?

User Manual

Let you quickly master DiVoMiner®

Helpful Tips

Help you to use DiVoMiner® handily

Start Now

DiVoMiner®,Data in Value out!

Copyright © 2024 DiVoMiner 丨 E-mail: info@divominer.com