hkbucomm – Manual
  • Language
    • 繁體中文
    • English

DiVoMiner® User Manual

  • Preface
    • What is DiVoMiner®
  • Quick start
    • How to quickly understand the platform
  • Online content analysis
    • What is online content analysis
  • Exploration
    • Trend
    • Communication Path
    • Favorability
    • Word Cloud
    • Leader
    • Top Posts
    • Data
    • Search Conditions
  • Pooling Management
    • Overview
    • Source
    • Coding Pool
    • Pretest Pool
    • Recycle Bin
  • Categorization
    • Create a question
    • Categorization
    • Import
    • Export
    • Preview
    • Keyword setting
    • Sentiment Model Analysis
  • Reliability Test
    • Precoding
    • Reliability Calculation
    • Tracking
  • Coding
    • Review
    • Feedback
  • Coding Performance
    • Coding Performance
  • Quality Control
    • Download
    • Filter
    • Batch Coding
    • Batch Operation
    • Column Control
  • Coding Result
  • Subject Setting
  • Analysis
    • Chart Profiles
    • Chart editing interface
    • Statistics Module
    • Descriptive Statistical Analysis
    • Correlation Analysis
    • Chi-square
    • Regression Analysis
    • Granger causality
    • Chart type
    • Table
    • Cross Table
    • Bar Chart
    • Line Chart
    • Pie Chart
    • Word cloud map
    • Sankey
    • Radar
    • Heat map
    • Dot Chart
  1. Home
  2. Docs
  3. DiVoMiner® User Manual
  4. Coding Result

Coding Result

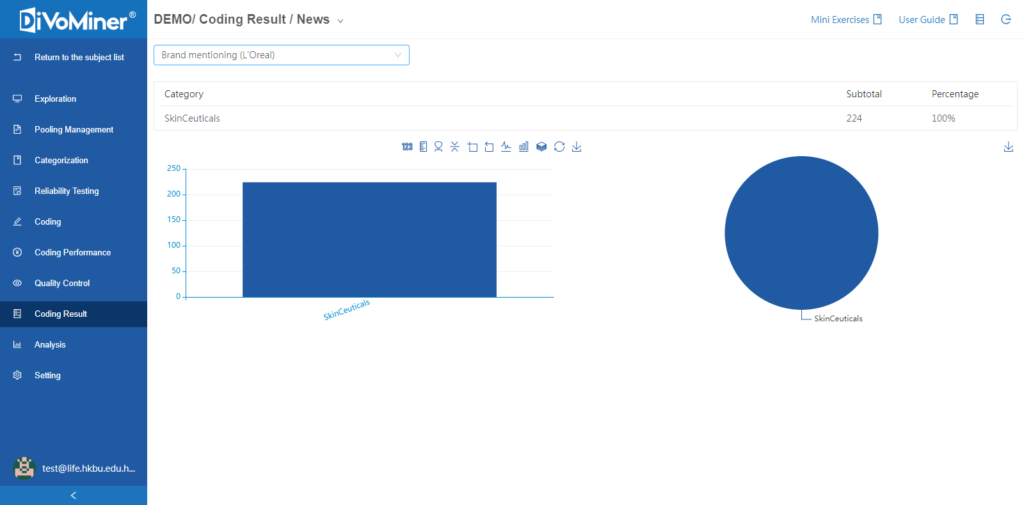
You can have a quick view of the number of options in individual category on the coding result page, and download the bar chart and pie chart.

Click a specific category , and the data will appear on the below.

Still having problems? We are here to help.
Updated on July 11, 2022

Doc navigation

← Quality ControlAnalysis →
Was this article helpful? Yes No

How can we help?

User Manual

Let you quickly master DiVoMiner®

Helpful Tips

Help you to use DiVoMiner® handily

Start Now

DiVoMiner®,Data in Value out!

Copyright © 2024 DiVoMiner 丨 E-mail: info@divominer.com